Cropland Cash Rent Trends
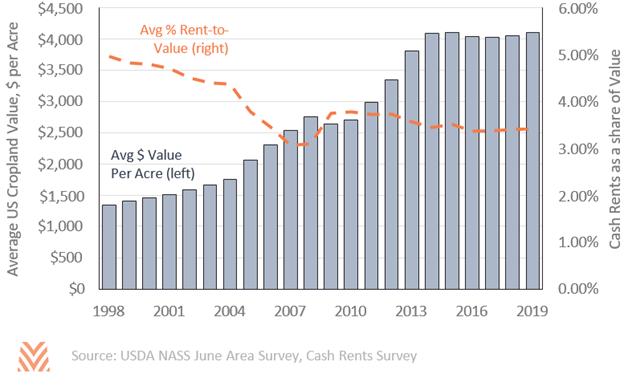
In 2019, the national ratio of cropland rents to value was 3.4%. This represents the fourth year of stable rent-to-value ratios but represents a decline from the commodity price boom. Through the late 1980s, agricultural economists found that farmland values could often be derived exclusively from cash rent. By 2004, researchers were beginning to find states where nonagricultural factors were a larger influence on land values than cash rents, especially in southeastern states. More recently, a low interest rate environment has buoyed land values despite lower returns from farming.
While one important nonfarm factor is urbanization pressure, other nonagricultural purposes can add value to agricultural land. Mineral-rich counties often see significant value derived from subsurface mineral rights. Nonmetro recreational counties can also see additional value from nonagricultural purposes. Even within agriculture, some land can be valued more for its water access than its productive capacity.
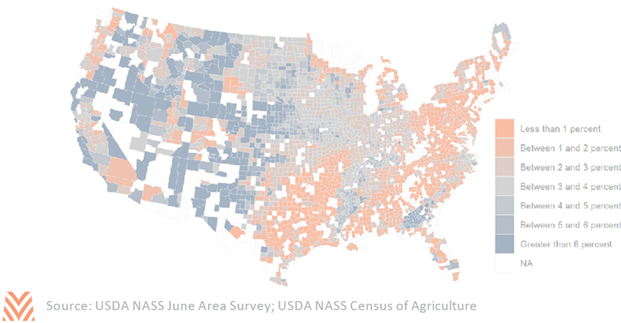
Using county-level data from the 2017 Census of Agriculture and the 2017 June Area Survey, many counties have rents representing less than 1% of land values. This is especially true along the east coast and southeast, where a body of literature has documented the influence of urbanization pressures. Generally, rent-to-value ratios are highest in states with the lowest land values, such as New Mexico, Montana, and Wyoming. In the Midwest and portions of the northern Great Plains, high cash rents have held up this ratio despite higher land values.
When compared against the 2012 cropland rent-to-value ratios, 60% of counties saw declines. Nationally, this was driven in part by a continued low interest rate environment that has lowered the cost of borrowing. Some declines are due in part to price changes for select commodities between 2012 and 2017, and impacts vary based on regional commodity specialization. Soybean-heavy states like Iowa saw declining cropland rent-to-value ratios in almost 90% of their counties. In many western Great Plains states, cash rents stayed relatively flat as a share of value between both periods. In counties along the eastern coast with significant poultry production, cash rents went up as a share of value.
In a recent survey of producers in Iowa asking why land values remained strong, just 10% of respondents explicitly mentioned agricultural production. After interest rates, producers listed limited supply, investor demand, and government payments as important factors. Continued declines in rent-to-values could imply that these other factors are gaining importance relative to production. Production is still the most important factor for land values nationally, but outside factors have provided welcome support during the current period of lower net farm incomes.