U.S.-China Trade Potential

The U.S.-China trade dispute took a more positive tone in early December, with both sides of the negotiating table announcing a preliminary phase one trade agreement. One component of the agreement involves China buying more U.S. agricultural products in 2020 and 2021. Although neither the U.S. nor China has released the exact details of the agreement at the time of this writing, officials involved in the negotiation have been quoted as putting the U.S. agricultural sales to China at $40 to $50 billion in each of the next two calendar years. If realized, these commitments would result in a significant increase in demand for U.S. agricultural production. However, many analysts and economists have cast doubt on the ability of China to absorb that level of farm products into normal economic activity. This article puts the $40 to $50 billion claim into a historical perspective of U.S. ag exports as well as China ag imports, and it evaluates the possible paths to $40 billion in 2020.
$40 billion in agricultural trade between two individual partners would be a staggering feat. The U.S. has been the world’s largest food and fiber exporter since at least 1990, the first year that global ag trade data is available from the United Nations. From 2013 to 2018, the U.S. has averaged $140 billion in annual ag exports to more than 200 trading partners across the globe. The largest export destination for U.S. ag production for the last five years has alternated between Canada and China, but in no year has the top buyer of U.S. ag bought more than $31 billion in inflation-adjusted values. China is often the top importer of global agricultural goods, averaging $110 billion in annual ag imports from 2013 to 2017. China reports over 150 ag trading partners, but the top two often account for 40% or more of all their agricultural imports: the U.S. and Brazil. But neither of those parties has ever exceeded $31 billion in inflation-adjusted imports to China. In other words, no single pair of trading partners in modern trading history has ever approached $40 billion in a single-year of ag sales. Between 2012 and 2017, the U.S. averaged only $22.7 billion per year in annual agricultural and agriculturally-related sales to China, leaving a wide gap to the goal of $40 billion.
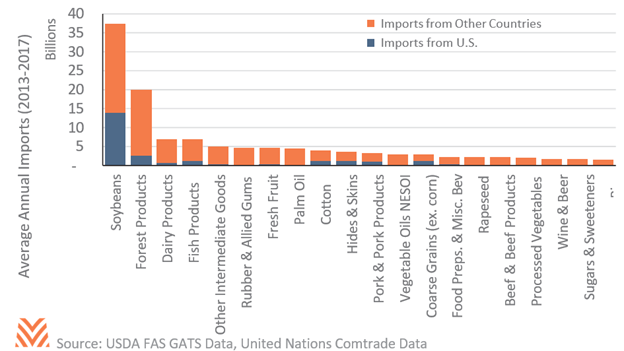
Although the proposed target sticks out compared to historical trends, there are a few potential paths to making the goal a reality. The figure below highlights the top 20 agricultural imports into China from 2012 to 2017, broken down by the U.S. share of the Chinese market. Importers bring in hundreds of individual food, fiber, and fuel commodities into China each year, but soybeans and forest products dominate the value of ag imports. Brazil has become the top soybean trade partner for Chinese importers, topping the U.S. share by more than $5 billion in sales annually. China’s recent approval of genetically modified soybean purchases and a lowering of retaliatory tariffs might be enough to flip that relationship and put U.S. sales up by as much as $5 billion. The U.S. ranks second in forest product sales to China, behind Russia. There is some overlap in Chinese lumber needs and the type of lumber exported by the U.S., particularly in ponderosa pine logs and coniferous lumber. There is also some additional Chinese market share potential for U.S. proteins, including dairy, beef, poultry, and pork. Finally, China has an ethanol mandate for 2020, and the ethanol industry in China has yet to mature. Without tariffs, the U.S. could export significantly more corn and ethanol to China in 2020 and 2021 to help meet blending requirements. Conversely, there is little potential for coarse grains or cotton, as the U.S. already maintains a high market share of recent Chinese import levels.
A more subtle way to increase U.S.-China agricultural trade would involve rerouting existing trade flows through Beijing. The U.S. currently sells $4 billion in agricultural goods to Hong Kong, a special administrative region of the People’s Republic of China. That $4 billion could be purchased by China and then re-exported to Hong Kong. A similar strategy could involve Taiwan, which imports $4 billion per year in U.S. agricultural products. It would be more challenging to reroute U.S. imports to Taiwan due to longstanding political tensions between Beijing and Taipei, but cross-strait relations between China and Taiwan are good enough to maintain roughly $150 billion in total trade annually. Finally, Vietnam has been importing more U.S. agricultural products in the last two years, totaling $4 billion in 2018. Combined, these three close trading partners of China import roughly $12 billion in U.S. agricultural goods each year. Rerouting trade flows would not impact demand for U.S. agricultural goods, merely the path they take to get to their final destination.
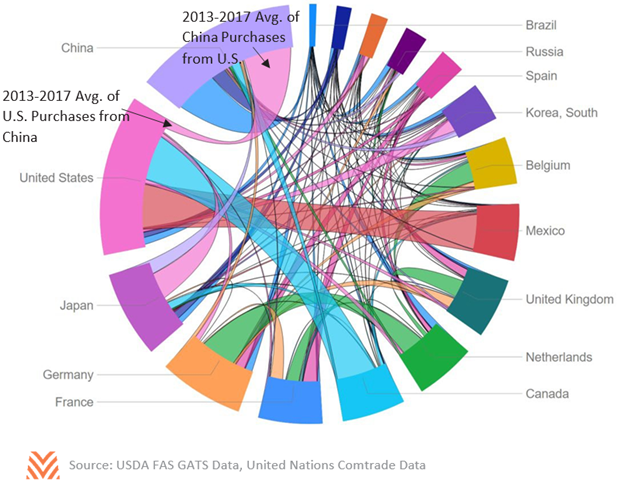
International trade is a complex and intricate ecosystem. As the figure below shows, even amongst the top 10 global ag trading partners, the patterns of agricultural trade are interwoven across all partners. A pluck of one string will reverberate across the others. China cannot simply buy more soybeans from the U.S. without affecting the other countries from which it buys soybeans, mainly Brazil. If China is to approach $40 billion in ag purchases in 2020, it will likely come from the three sources mentioned above: slight increases in existing purchase patterns (e.g., soybeans and forest products), growth in new purchase patterns (e.g., proteins and ethanol), and technical trade rerouting through other Asian partners.