Net Farm Income Update

On September 2, the USDA’s Economic Research Service (“ERS”) released their first set of estimates and forecasts for farm income and wealth since the start of the ongoing pandemic. With this release, the USDA released their first set of final estimates for 2019 farm income and their second forecast of farm incomes for 2020.
Overview
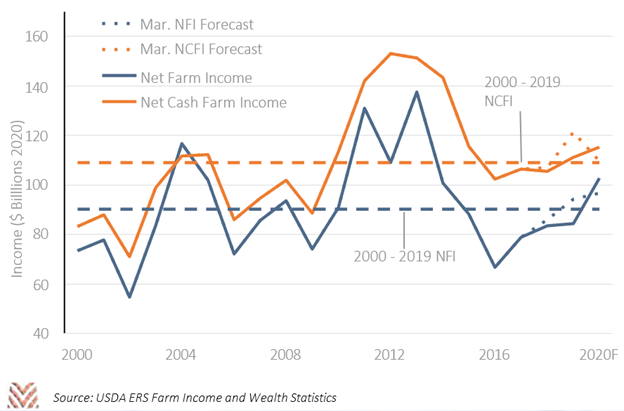
Farm income forecasts for 2020 are generally up, despite the ongoing pandemic. Net farm income (“NFI”), the USDA’s primary measurement of farm well-being, was revised up 6% from the pre- pandemic forecast to $109.6 billion. Net cash farm income (“NCFI”), a simpler measure that reflects producers’ cash on hand, was revised up 5% to $115.2 billion. In inflation-adjusted dollars, these incomes were at or above those in 2015, the final year of the commodity supercycle. These increases mean that incomes for 2020 are forecast to be above their inflation-adjusted averages since 2000. However, farm incomes were revised down by more than $10 billion for the period between 2017 and 2019.
Strong government support was the primary reason that income forecasts were revised up in 2020. Certain segments of the agricultural sector also had some luck that helped boost incomes after the government programs were created. The USDA NASS’ June acreage report led to almost a billion- bushel decline in forecasts for U.S. corn production. National heat waves led to tight milk supplies that helped boost prices. Even U.S. hog producers, who saw the biggest hits to income, could see relief if September’s outbreak of African Swine Fever in Germany leads to a surge in demand for U.S. pork. These modest improvements in market conditions are critical, as they are more sustainable than the current atypical government support.
Government Payments
The USDA forecasts that direct government support will total $37.2 billion in 2020. This dwarfs even the substantial volume of payments in 2019 that stemmed from the Market Facilitation Program. Direct payments will be the highest in U.S. history even in inflation-adjusted terms, surpassing events like the 1980s agricultural crisis and the severe weather years in the early 2000s. 2020 direct payments will be double the average seen from 2000 to 2019, but still make up a smaller share of net farm income than was the case during the severe weather years of the early 2000s.
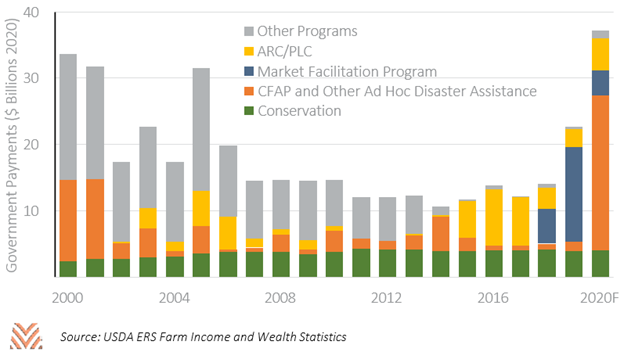
The assumptions that the USDA ERS makes about government programs can give us some indication of the intentions for the department through the end of 2020. The ERS assumes that $16 billion in Coronavirus Food Assistance Program (“CFAP”) payments will be distributed in 2020, even though program disbursements had slowed and were just over $10 billion through early September. The ERS also makes no assumptions around the use of the $14 billion replenishment of the Commodity Credit Corporation (“CCC”) that happened with the CARES act.
These historic numbers are likely to be revised up in the ERS’ November release. The second round of CFAP payments pledge to send up to $14 billion to producers in a manner similar to the first CFAP round. If both programs are fully used, direct government support in 2020 could surpass $50 billion. Congress’ replenishment of the CCC also means that USDA will have excess authorities going into 2021. Should conditions require it, the USDA will be able to create another round of ad-hoc programs to bolster producer incomes if lower price environments persist through 2021.
Commodity Variation
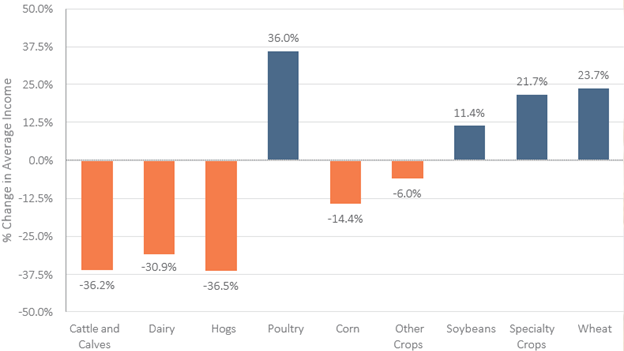
The increase in NFI between the March and September releases masks a considerable variation in outcomes based on producer commodity. Across animal and animal product producers, the USDA forecasts significant income declines. Hog, dairy, and cattle and calf producers all saw the forecast for their average incomes fall 30% between the March and September releases. For cash grains, only corn saw significant pressure, due to its unique exposure from ethanol. Corn producers saw their forecast incomes fall 14%, while soybeans and wheat both saw their forecast incomes rise. Despite expected pressure on consumer- oriented goods, specialty crop producers also saw forecast incomes rise in the September release.
A full accounting of CFAP funds may help address some of the deviations in changes to average expected incomes for producers in 2020. Cattle and calf operations have received $4.2 billion through early September, making up more than 80% of forecasted declines in cash receipts. However, other commodities may see challenges. Hog producers have received $600 million in payments, making up just over 15% of the decline in cash receipts forecasted between 2019 and 2020. Some of this variation can be attributed to the specifics of the CFAP program; the consolidated nature of hog and dairy production means those producers are more likely to be subject to CFAP caps than the more diffuse cattle and calf industry.
Despite the coronavirus pandemic, many producers will not see their incomes decline in 2020. This is largely due to government support, but a small amount of luck has also improved market conditions for many commodities. As of early September, hog producers remain exposed due to their consolidation and poor market conditions. However, most producers can start thinking about 2021. The University of Missouri’s Food and Agricultural Policy Research Institute issued a release shortly after the USDA’s September income forecast that forecast a 15% decline in NCFI between 2020 and 2021. Continued poor market conditions for many commodities may threaten producer incomes in 2021. Producers should be confidence that the USDA’s excess authorities mean that it can continue to step in if market conditions dictate a response.