Farm Income Update: 2021 Ends on a Strong Note
On December 1, the USDA ERS released their final Farm Income and Wealth Statistics update for 2021. This release is the first to account for new data from the 2020 Agricultural Resource Management Survey (ARMS) and contains price data for 2021 that are largely complete. Despite falling market prices and evidence of rising expenses since the September release, overall sector net cash income forecasts for 2021 were largely unchanged at $133 billion. This new release confirms the USDA’s earlier projections that producers will see very strong incomes in 2021.
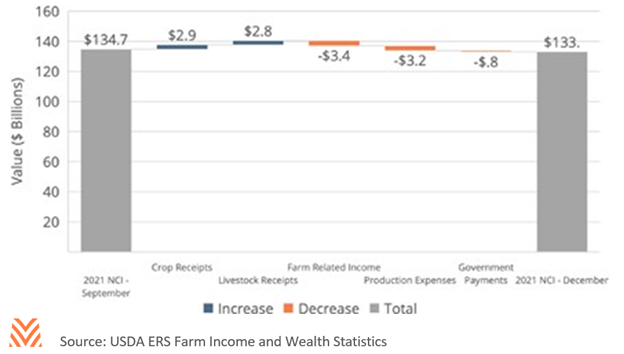
Changes from September
The December forecast for 2021 shows continued good news for farmers and ranchers. The ERS forecasts that cash receipts will be even stronger than suggested by their previous forecast, which had already forecast a sizable increase in cash expenses. The new data show that cash expenses are forecast to rise 8.6% in 2021, rather than the 7.7% the ERS forecast in September. Meanwhile, farm-related income, which ranges from custom work to insurance indemnities, substantially declined between the two reports. This was due almost entirely to a decline in forecasts for 2021 federal indemnities.
At a more granular level, there were several significant changes between the two releases. The USDA’s estimate for working capital in 2021 was revised up by more than 10%. This was driven in part by changes in end of year inventory projections, which rose from 15- year lows to average levels on stronger than anticipated production. These changes also led to considerable improvement in sector liquidity and efficiency ratios. Several commodities saw large fluctuations that largely followed recent price movements. Soybeans and hog cash receipts were revised down 10% from September levels, while cotton and poultry receipts rose a similar amount.
Financial Health
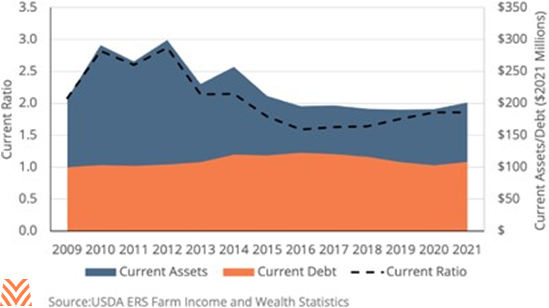
While the December release appears to confirm the USDA’s belief that producers will have had a good year in 2021, the USDA report also signals some interesting trends in financial health. Net cash income is forecast to rise 15% over 2020 levels, but the sector’s current ratio is forecast to remain unchanged from 2020. Current assets are forecast to rise modestly, but the increase in current debt is forecast to keep pace with this increase. While sector liquidity is higher than it was during the lower farm income years between 2016 and 2018, the high incomes of 2021 have yet to translate to the sector balance sheets.
There are several reasons why sector liquidity remains lower. First, rapid sales have depleted stocks and have led to moderate inventory values. During the commodity supercycle, the USDA estimates that producers had an additional $20 billion in assets from crop inventories alone. Producers are also forecast to enter 2022 with the lowest level of purchased inputs since the USDA began collecting data in 2012. But the largest difference between the supercycle era and today is producers’ other financial assets. In 2012, the USDA estimated that producers had over $155 billion in these liquid assets. The December forecast for 2021 is less than two thirds of that level, at $94 billion.
The potential good news for lenders is that the USDA’s forecast for financial assets does not reflect 2021 data. The measure for financial assets and net accounts receivable comes from the annual Agricultural Resource Management Survey, which asks producers about prior year incomes and expenses. The USDA estimates for 2021 working capital will not reflect producers’ responses for their cash on hand in 2021 until their second release in 2022. Given the volatility of this series, it is possible that producers’ liquidity position will look far better once these data are accounted for.
The USDA’s overall picture shows a sector that is modestly more liquid and leveraged. The sector’s rate of return and debt service ratio are at their best point since 2014. Measures of profitability are also at their highest point since 2014. But solvency measures like the sector debt-to-asset ratio have continued to deteriorate despite the strong income of 2021. In 2020, the USDA estimates that sector debt-to- asset ratios increased even as farmland values increased by 7%. Current forecasts for 2021 indicate that the sector will be at its most leveraged point since 1999, even if it remains near long-run historic averages.
Changing Production
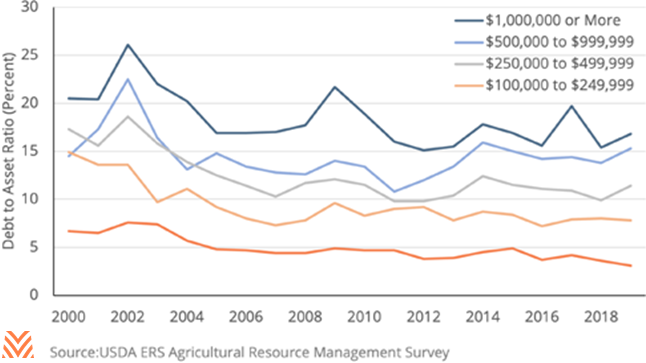
The discussion around sector leverage often misses one important point: the sector is consolidating. Small farms are unlikely to use farm debt, while large ones often do. The USDA releases the ARMS data used for some estimates shortly after their December release. These data allow us to look at financial strain by economic class. The figure below shows debt-to-asset ratios for farms by economic class between 2000 and 2019.
The ARMS data suggest that sector leverage is not increasing, except for farms between $500,000 and $999,999 in annual gross cash farm income. Since 2000, the number of midsize and large farms has more than doubled, while the number of moderate and small farms (those with less than $250,000 in gross cash farm income) has declined. This has resulted in a sector-wide increase in debt-to-asset ratios, even as strain levels for most operations have not increased over time.
The USDA itself noted that measures of severe strain are declining. The number of farm bankruptcies for the 12-month period ending September 30, 2021 was 344, well below 2019 and 2020 levels. Commercial bank delinquency rates and charge-offs have continued to fall as high incomes allow for greater debt repayment. As the sector continues to consolidate, the USDA ERS’s financial health metrics may continue to show deteriorating financial ratios, even if individual farm conditions have improved. In sum, the USDA’s December release portrays a farm economy that is recovering from years of lower farm incomes.
Cash receipt income continues to rise as crop prices hold and animal protein markets recover. Expenses are high, but not enough to overwhelm robust prices. Sector liquidity and solvency could be stronger, but the USDA’s figures don’t contain 2021 survey data and may not be fully accounting for farm consolidation. Farmers and ranchers might not be experiencing the supercycle, but after a very uncertain 2020, the strong incomes of 2021 will be more than welcome.