Corn and Soybeans

Corn
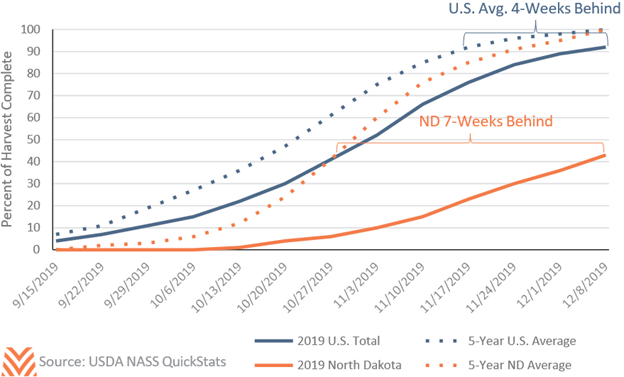
For a fourth consecutive year, the USDA projects a tightening of global corn supplies. The U.S. corn crop was beset with poor planting conditions in the spring, which led to a delayed harvest in the fall. Through December 8, growers had harvested 92% of the corn crop, compared to an average of 99% during the last five years (each of which had nearly perfect weather for corn production). The average corn acre is approximately four weeks behind recent experience. However, there are a handful of states in the upper Midwest experiencing a greater harvest extension, as winter weather has buried many unharvested acres. Growers in North Dakota are particularly affected by the harvest delays, with just over 40% of the crop harvested in the first week of December. The USDA projects an average yield of 167 bushels per acre, a 5.4% decline from 2018. Global supplies are also down in 2019/20, largely as a result of the drop in the U.S. crop. South American production was up in 2019, creating increased competition for the U.S. supply on the world stage.
Demand for U.S. corn is also down slightly in 2019. Corn use for feed is down from 2018 due to higher prices. Ethanol production was down nearly 2% in 2019 due to lower oil prices and refiner blend exemptions that compressed producer margins. Ethanol margins were so thin at times during the year that some plants were forced to cease production rather than continuing at a loss. Corn exports were also down significantly in 2019. Through October, U.S. corn exports were down 38% compared to 2018, with double-digit declines in most major export destinations. Purchases from Mexico, Japan, and South Korea are down a total of $1.7 billion in sales compared to January through October 2018. Strong crops in Argentina and Brazil have proven to be stiff competition in these top markets. However, the declines in supply have more- than offset the declines in demand, and corn prices have firmed throughout the fall and winter months. The corn stocks-to-use ratio, a measure of the ending supply to total demand, is projected to be a four-year low in 2020. This supply-demand dynamic is why the USDA projects the season-average corn price at $3.85 per bushel. Corn growers could see some upside to thawing relations with China if ethanol exports pick up in 2020.
Soybeans
U.S. soybean supplies are down considerably in 2020. Anticipating the persistently-low soybean prices due to ongoing trade friction with China, U.S. growers planted 13 million fewer acres of soybeans in 2019 compared to 2018. The lower acreage, combined with poor weather throughout the growing season, has lowered total soybean production by more than 20%. However, South American production set a record in 2019, and will likely break that record in 2020. Price signals in Brazil and Argentina have encouraged increased planting to soybeans, as a stronger U.S. dollar and weaker local currencies improve local prices for growers.
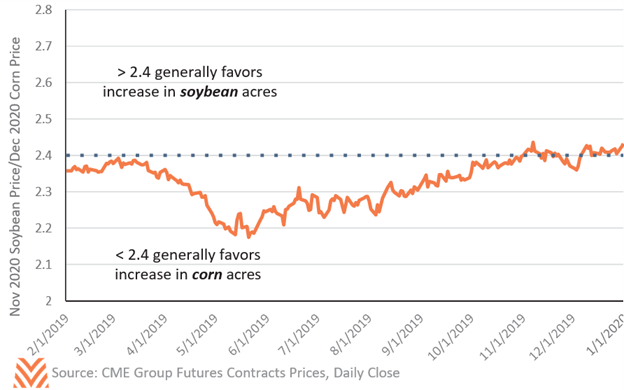
There exists considerable uncertainty around soybean demand in 2020. Domestic soybean crush has been stable in 2019, with steady demand coming from biodiesel and soybean meal for animal feed. U.S. exports remain depressed due to elevated tariffs between the U.S. and China, which includes soybeans. Not only are the prices higher due to tariffs, but total soybean demand in China is down, with fewer hogs on feed in 2019. The Chinese hog industry continues to battle the widespread outbreak of African swine fever throughout its provinces. The World Organization for Animal Health estimates that more than 200 million hogs have been culled as a result of the outbreak, roughly 40% of Chinese hog inventory. However, U.S. soybean sales to China picked up in the fourth quarter of 2019, and grain traders are bullish on the possible benefits to soybean prices if a phase one trade agreement with China is realized. In December, the USDA estimated the 2019/2020 farm price for soybeans at $8.85, but there has been considerable volatility in soybean prices, as the stocks-to-use ratio has been choppy the last two years. A trade agreement with China could bring additional planted acres in 2020, particularly if the soybean-to-corn price ratio stays above 2.4 (see the figure below). In early January, the new crop soybean-to-corn price ratio was hovering around 2.4, which historically signaled that growers would maintain their mix of corn and soybeans in the coming marketing year.