Consumer Food Purchases During a Pandemic

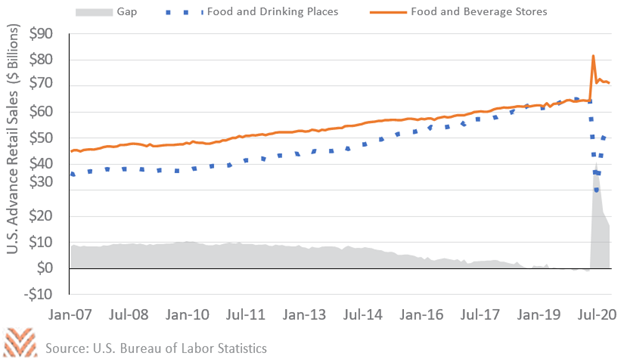
One of the sweeping changes in consumer behavior resulting from COVID-19 is in how and where we buy our food. Advance retail sales data highlight an extreme break in consumer behavior that started in April 2020. From 1992 through 2014, U.S. consumers spent $10 billion more per month in food for home consumption compared to food purchased and eaten away from home. That gap slowly eroded between 2015 and 2019 until consumers were routinely spending more on food outside the home than in-home. The convenience and variety of food choices, combined with higher post-recession incomes, rapidly transformed food demand heading into 2020. Things were looking up for dining and drinking venues—until the restaurants suddenly and almost universally shuttered. As the figure below shows, sales at food and beverage stores (like grocery stores) spiked in March as consumers prepared for quarantines. Simultaneously, sales at food and drinking places (e.g., restaurants) started to slip, and plummeted 54% in April. Restaurant reservations in the U.S. on the online platform OpenTable fell 100% by March 29, and they remained near zero until May 1. By August, restaurant sales rebounded considerably, but the gap between at-home and out-of-the home food sales remained at an all-time high.

It’s difficult to predict how long social distancing and COVID precautions will keep consumers away from restaurants, and how much of the bounce back may be lost as colder temperatures start to make al fresco dining less and less appealing. However, according to data from Yelp, thousands of restaurants have already permanently closed as a result of the sharp decline in demand. Furthermore, shopping habits tend to tighten during economic slowdowns. The amount of food consumed away from home tends to rise and fall with incomes, so a prolonged and slow economic recovery could keep shoppers at grocery stores through much of 2021.
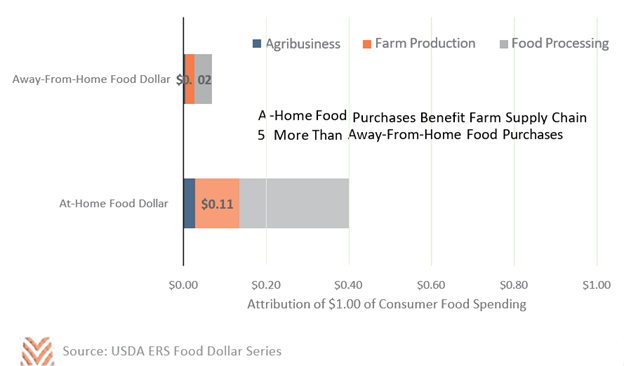
Consumer food choices have an important role in farm revenues. Analysis from the USDA demonstrates how the food dollar gets distributed along the food supply chain. Much more of the food dollar is allocated in marketing, packing, transportation, and service costs compared to food production and processing. The figure below highlights the stark difference between the farm production share of the food dollar in at-home versus away-from-home spending. For every $1 spent on food at home, $0.11 is allocated to farm production; but for food away from home, that figure is only $0.02. Because farm producers and processors receive a much higher share of the at-home food dollar, the resurgence in grocery sales and in-home dining could provide support to the ag sector.


