Analyst’s Corner: Farm Income Forecasts in a Changing Environment

Last year was a lesson in humility for agricultural economists who forecast farm incomes, including the authors of The Feed. After historic low prices were forecasted for many commodities, markets saw a resurgence. In a single year, we saw the most agricultural exports ever in a single month, record government payments, and large production revisions. This shifting environment led to large swings in forecast incomes for 2020.
Luckily, in response to this change, the USDA’s Economic Research Service (ERS) released a whitepaper that outlined a means to update farm income forecasts between their major releases to better account for changing market conditions. By taking a few additional pieces of data, we can get some sense of how strong incomes may be for 2021.
Futures-derived Prices
While many components of net cash farm income are difficult to forecast continuously, it is easier to account for changes in cash receipts for major commodities. At a national level, the ERS estimates cash receipts as the average farm price received times total use, excluding on-farm use. The World Agricultural Supply and Demand Estimates (WASDE) provide monthly forecasts of production and farm prices for commodities that cover more than 75% of total cash receipts. These data can be used to replace cash receipt forecasts for these major commodities at a national level and can give some insight into how farm income forecasts are changing. However, while animal products have prices for the 2021 calendar year in the latest WASDE, there is one challenge for crops. Crop calendar year incomes for 2021 require forecasts for both the 2020/21 crop marketing year (CMY) and the 2021/22 CMY. Producers will receive income based on the shares of both 2020/21 and 2021/22 CMY crops they sold during the calendar year 2021. The latter CMY does not have WASDE forecasts until midway through the year.
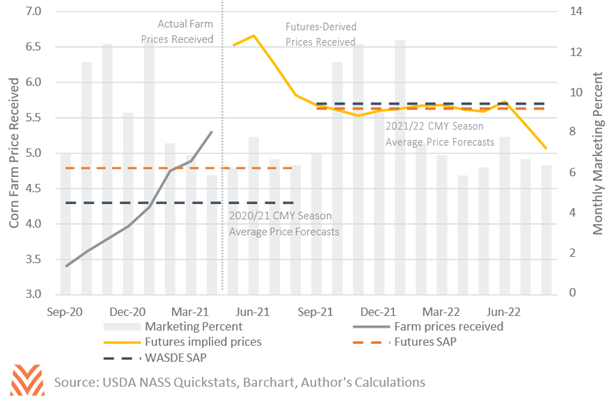
ERS’ Market and Trade Economic Division (MTED) has a potential solution. MTED creates season-average price (SAP) forecasts through a combination of actual farm prices received and futures markets. By combining these data with historic monthly marketing weights and basis, we can forecast a season average price so long as there are futures data. As an example, the figure below represents how this would apply to corn prices at the beginning of June. For the 2020/21 CMY, the season average price is a function of both actual farm prices received and futures prices. The 2021/22 CMY is derived exclusively from futures prices.

The 2020/21 CMY SAP of $4.79 represents a divergence from the May WASDE, which forecast corn farm prices received at $4.35. However, the current futures-derived SAP for the 2021/22 CMY is within 7 cents of the May WASDE forecast. In volatile markets, these futures-derived prices may be preferable due to their ability to react to changing circumstances. Still, there are limits to the use of futures-derived prices. If basis points widen in a high price environment, this model may overestimate SAP. Marketing percentages may change as we’ve seen with larger Chinese corn purchases at the beginning of the calendar year. This reliance on historic data over current marketing and basis information means that the WASDE forecasts are preferred in low price volatility environments where available.
Updating Cash Receipts
Now that we have price information, the next phase is to look for total use forecasts for the 2021/22 CMY. Once again, the WASDE provides 2021 use forecasts for animal products. Like with prices, there are no total use forecasts for 2021/22 CMY crops during the first part of the calendar year. We bypassed this issue by taking the USDA’s preliminary forecasts for the 2021/22 CMY, released during the annual Ag Outlook Forum. As new data become available, such as revised planted acres or yields, these figures can be adjusted, until a formal forecast is released in the WASDE.
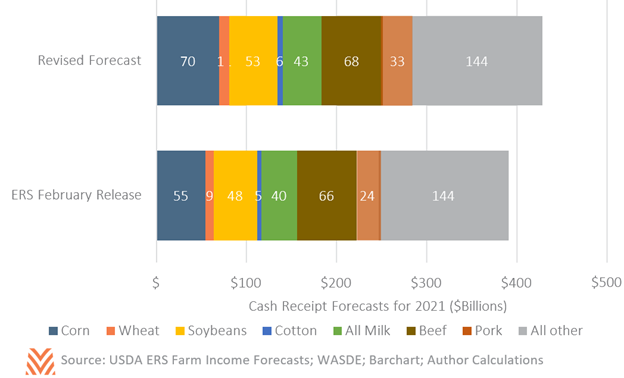
With revised price and use data, we can now begin updating the cash receipt totals used in the ERS forecast. However, not all data can be used in the same fashion. Crop cash receipts can be substituted directly as the share of 2020/21 and 2021/22 CMY crops sold during 2021. Animal products are slightly different. The ERS’ measure of cash receipts differs from what is contained in WASDE. The ERS’ recommendation in their whitepaper to address this problem was to index the value of total use in the latest WASDE against the WASDE data that would have been available at the time of the last ERS release. With this information, we can now create revised cash receipt forecasts, as shown in the figure below.

The changes to these commodities alone would represent an additional $37.2 billion in cash receipts over the USDA ERS’ February forecasts. If realized, this would lead to cash receipts of $428 billion in 2021, well below supercycle peaks but strong by any other measure. While this does not tell what net cash income will be in 2021, we may assume that many other components will stay the same. Government incomes will likely be high this year due to residual payments from the ad- hoc programs of 2020. Select expenses, like interest and property taxes, will likely not change much in the USDA’s August release, though other expenses like feed, seed, and fuels may see gains. If we hold all other portions of cash income constant, producers would see almost $165 billion in net cash income in 2021, higher even than in the supercycle era.
There are many reasons this may not occur. If producers increased their acreage after the prospective planting report, cash grains may see far higher production. High grain costs may lead to a surge in feed expenses. Other scalable inputs may rise as producers seek to take advantage of high commodity prices. However, all data point towards a strong-to-great year for farm incomes in 2021.


