Ag Bank Volume Update

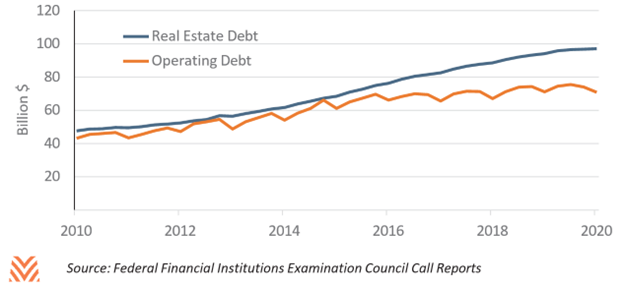
At the end of 2019, agricultural volumes at FDIC- insured banks had grown for a decade. Even the 2008 financial crisis had limited impact on increasing loan volumes, only briefly pausing their upward trajectory. But as the decade ended, there were some indicators that this rapid ascent was slowing. Real estate loan volume growth slowed through 2019, and the Federal Reserve Bank of Kansas found that operating debt had decreased through Q4 2019.
We can get a glimpse into whether this trend is continuing into 2020. Due to the ongoing pandemic, banks have had additional time to submit their call report data, delaying the official report. However, the Federal Financial Institutions Examination Council (FFIEC) has released call reports for the 90% of banks that have already filed. This subset will enable us to estimate if the current trends have continued before the full data are released later this year.
Total Loan Volumes
From the observed banks, it is likely that the trends from prior quarters have continued. Operating loan volumes have declined year-over-year between Q1 2019 and Q1 2020 by less than a percent. Real estate loan volumes for this group continued to rise, but by a lower percentage than in prior years. The 3% year-over-year growth represents a decline from over 10% per year during the commodity supercycle. Among all banks, real estate volumes were lower in Q4 2019 than Q4 2018, signaling that volume declines are possible this year.
Trends in Bank Growth
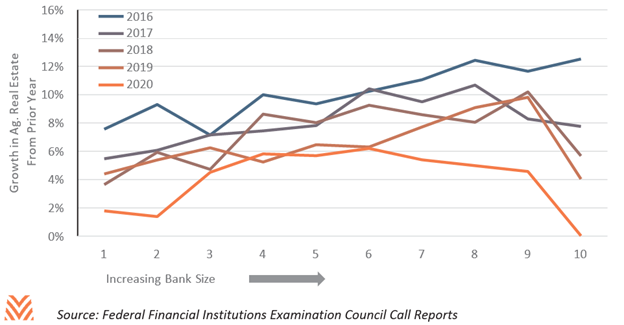
The slowing growth in loan volumes is not even across all banks. The smallest 20% of banks by total assets saw year-over-year growth in their agricultural real estate portfolio of under 2%. The median bank, with $220 million in assets under management, saw growth near 6%. However, the largest 10% of banks, with more than $1.4 billion under management, saw no growth in their agricultural real estate volumes year-over-year. This paints a picture of mid-size community banks and regional banks growing agricultural volumes more than either national banks or small community banks.
This is different than what we saw in earlier years. At the tail end of the commodity supercycle, the largest 10% of banks were rapidly growing their agricultural real estate portfolios, exceeding growth above 12% per year. While growth has fallen across all asset size classes, the largest banks went from growing the fastest in 2016 to not growing at all in 2020. Growth has fallen the least among mid-size banks with between $200 million and $1 billion in assets under management.
Growth in agricultural portfolios has also been strongest in banks that have existing agricultural portfolios. Put another way, commercial banks without significant agricultural experience have not seen growth in their agricultural holdings. However, growth does not increase with concentration once a portfolio has been established. The median bank in Q1 2020 had 6% of their portfolio in agriculture and saw 4% growth in their real estate volumes. The 10% of banks most concentrated in agriculture also saw 4% volume growth.
Regional Differences
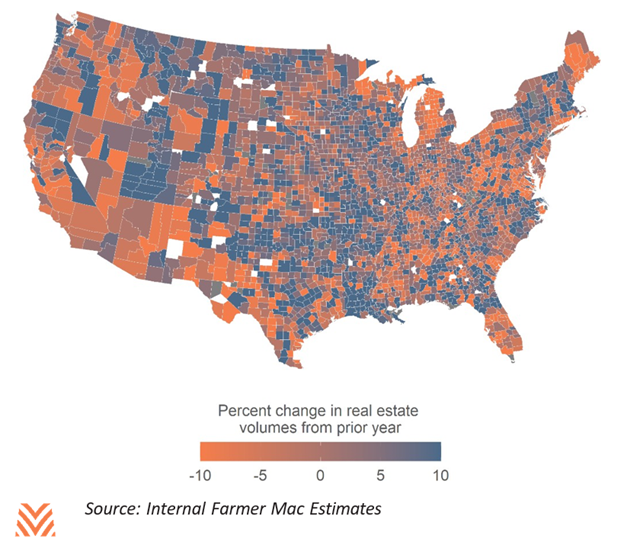
There are also differences in how volumes have changed across the country. Mid-size commercial banks with some experience in agriculture are most common in the Western Corn Belt and Northern Great Plains. Conversely, many coastal regions tend to rely on the larger commercial banks that have seen slower growth over the last year. Coastal regions are also frequently served by banks with low concentrations in agriculture. This implies that those regions are more likely to have seen zero or negative growth in real estate volumes over the last year among all commercial banks.
By using interest expense data from the Census of Agriculture combined with additional regulatory data from the FDIC, we can estimate total lending into a county from all commercial bank lenders. There are some regional patterns that emerge from this analysis. States that saw significant strain due to the struggles of the dairy industry, like Michigan, are estimated to have seen lower or negative growth. In general, the Great Plains have outperformed the rest of the country, though areas like southeast South Dakota with significant flooding have not seen the same growth. In general, the Western Corn Belt appears to have seen strong real estate loan volume growth, though evidence is more mixed in the Eastern Corn Belt. Many important agricultural regions along the coasts are estimated to have seen sharp declines in their real estate volumes.
Heading into the pandemic, agricultural lending was already seeing slower growth. The large banks that used to lead this volume growth have shown much slower growth as of the latest data. Some signs point to lower growth in coastal regions or regions that are heavily reliant on strained commodities. Nonperforming rates were largely the same as the prior year. In short, commercial bank lending was plateauing even before the start of the additional uncertainty that came with the arrival of COVID-19. The combination of these factors could be the undoing of a decade of commercial bank expansion into agricultural real estate. But if history is any guide, the contraction may be short-lived, and a credit cycle expansion could soon return.