

Does It Pay to Farm Every Acre you Own?
AgWeb Powered by Farm Journal
By: Sara Schafer
In most areas, average operator returns exceed rental returns for farmland. But, with recent declines in crop prices and farmer profitability, the scales are tipping in some areas. That’s according to recent analysis from Farmer Mac economists in their quarterly newsletter, The Feed.
“One of the things we took a look at in this most recent edition of ‘The Feed’ was that difference between return for operators and returns for landlords if you rent out your ground,” says Jackson Takach, Farmer Mac economist. “Are you going to actually make more money than if you planted a crop to it?”
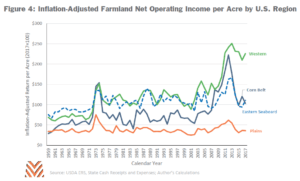
To find this answer, the economists studied income and rental trends. Look at the pattern of inflation-adjusted net operating income (NOI) per acre over time. You see the predictable jumps and dips over time.
The interesting trends are on a regional basis:
- Corn Belt: Average profitability swelled in 2012 due to drought, high grain prices and crop insurance payments. But since 2012, average NOI has fallen by more than $100 per acre. The inflation-adjusted NOI in Illinois peaked in 2012 at more than $440 per acre (6.6% of average land values in the state) but hit just $223 in 2017 (3% of average land values).
- Western: NOI for Western agriculture has increased significantly since 2007 due to an increase in consumer preference for fruits, vegetables, and particularly nuts. In California, inflation-adjusted NOI peaked in 2013 at $723 per acre (9.9% of average land values) and had only fallen to $622 per acre in 2017 (7.1% of average land values).
- Plains: Overall, NOI has been lower than in other areas, primarily due to lower yields and greater land use for pasture.
- Eastern: Farmland has experienced stable NOI returns for operators, keeping pace with inflation.
Now, take a look at this map, which plots each state’s average real operating profit against its average after-tax cash rental return from 1994 to 2017. The size of each bubble is related to the total value of agricultural real estate in the state.
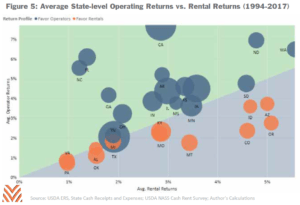
Most states fall near the middle, where operating returns are near or slightly higher than rental returns. Southeastern states like Florida, Georgia and North Carolina tend to have lower rental rates, while Mountain and Plains states like Idaho, Colorado and Arizona tend to have higher rental rates. States with a higher percentage of their cash receipts tied to permanent crops like these tend to have higher returns (ex: California).
“Lately in the Midwest, the rental returns have started to exceed those of the operating returns,” Takach says. “But that margin has really shrunk.”
For example, the real operator returns in Corn Belt states averaged more than 2.5% higher-than average real after-tax rental returns from 2008 to 2013. Since 2013, cash rents in the Corn Belt increased, and the gap between operating rates and rental returns narrowed and even inverted for some states in 2016 and 2017.
This profit squeeze means farmers should have proactive conversations with their landlords, Takach recommends. “Maybe that rental rate has to come down a little bit in order to make it all work for the operator and the landlord.”
Average rental returns offer lower volatility compared to operating returns, according to the report. But that also limits upside potential from year to year as increases in NOI are absorbed into rental rates over several future periods.
To subscribe to The Feed, produced by Farmer Mac, visit www.farmermac.com/thefeed.
To View Full Article: Click Here