

Global AgInvesting
Comparing Operating Strategies to Maximize Farmland Returns
By: Jackson Takach, Director of Economic Research and Business Innovation, Farmer Mac
This article will be featured along with other articles addressing investment opportunities in agriculture and surrounding themes in the GAI Gazette, Volume 6, Issue 1, which will be distributed in conjunction with the 11th annual flagship Global AgInvesting event, held in New York City on April 1-3, 2019. Join Jackson Takach in New York for his presentation exploring a macro view of investment opportunities and return profiles for U.S. farmland. Learn more and register.
U.S. farmland owners – both agricultural producers and land investors alike – have dozens of decisions to make, but one of the most fundamental is how best to put their land assets to use. For some, renting the land to other producers provides adequate cash flow to meet financial needs and required returns. For others, agricultural production and operational expertise can provide the cash flow and returns to land holdings (not to mention the lifestyle and tradition that many operators in agriculture desire). While the decision to operate or rent depends on many land-and-owner-specific factors, geographic location and historical returns are two important factors with enough data to evaluate on a macro level.
Historical Operating Returns by Region
Different regions of the U.S. offer vastly different soil types, climates, and available technology that lead to different blends of agricultural production. For example, the silty clay loam soil covering Iowa combined with advanced seed technology make corn and soybeans the logical choice for nearly 90 percent of farmland in the state. Conversely, the varied soil types, micro-climates, and long growing season give California growers the ability to produce more than 200 different crops. Regardless of the crop grown, all production experiences market price volatility and changing cost of production, giving rise to net income volatility.
Using state-level USDA cash receipt, expense, and acreage data, Figure 1 highlights the historical trends in regional inflation-adjusted net operating income (NOI) per acre. Each region’s NOI tended to increase in the two major farm profitability expansions in the 1970s and 2010s, but the timing and magnitude of changes vary by region. Average profitability in the Corn Belt swelled in 2012 due to widespread drought and the high grain prices and crop insurance payments that followed. Since 2012, average NOI in the Corn Belt has fallen by more than $100 per acre, predominantly in grain-intensive states like Iowa and Illinois. The inflation-adjusted NOI in Illinois peaked in 2012 at over $440 per acre (6.6 percent of average land values in the state) but registered just $223 in 2017 (3.0 percent of average land values).
NOI for Western agriculture has increased significantly since 2007 due to an increase in consumer preference for fruits, vegetables, and particularly nuts. In California, inflation-adjusted NOI peaked in 2013 at $723 per acre (9.9 percent of average land values) and had only fallen to $622 per acre in 2017 (7.1 percent of average land values). Overall, NOI in the Plains region has been lower than other areas primarily due to lower yields and greater land use for pasture. Finally, farmland in Eastern states has experienced very stable NOI returns for operators, increasing at the pace of inflation.
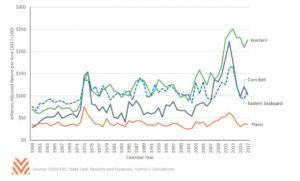
Figure 1: Inflation-Adjusted Farmland Net Operating Income per Acre by U.S. Region
Rental Returns Compared
In addition to revenues and expenses, the USDA surveys thousands of farmers per year to estimate average cash rental rates at the state and county level. Naturally, operating returns tend to be higher than rental returns as operators would not rent land for more than they expect to earn farming it. However, there are periods and states where rental returns are more consistent and even higher than operating profits. For example, the real operator returns in Corn Belt states averaged more than 2.5 percent higher than average real after-tax rental returns from 2008 to 2013. Since 2013, cash rental rents in the Corn Belt increased, and the gap narrowed, inverting for some states in 2016 and 2017.
For most states, returns from rental income are lower than operating returns, but they also exhibit lower volatility from year-to-year. Cash rents tend to be sticky as many operators will enter into multi-year contracts at fixed and semi-fixed prices.
Figure 2 plots each state’s average real operating profit against its average after-tax cash rental return from 1994 to 2017. The size of each bubble is related to the total value of agricultural real estate in the state. Most states fall near the identity line where operating returns are near or slightly higher than rental returns. Southeastern states like Florida, Georgia, and North Carolina tend to have lower rental rates, but Mountain and Plains states like Idaho, Colorado, and Arizona tend to have higher rental rates (likely due to the higher rents associated with irrigated cropland, a quirk of the survey data reported by the USDA). Average operating returns to California farmland has far outpaced rental returns due to the large returns on nut crops and other orchard crops. States with a higher percentage of their cash receipts to permanent crops tended to have higher returns, a result of the higher margins achieved by fruits, nuts, and vegetables and the additional investments required in the trees and vines to produce the crops.
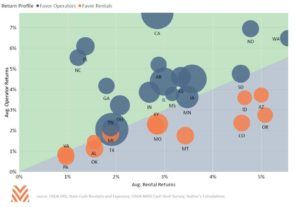
Figure 2: Average State-level Operating Returns vs. Rental Returns (1994-2017)
The Final Word
For most regions, average NOI per acre followed the expansions and contractions of the commodity price booms in the 1970s and 2010s. Corn Belt per acre returns have lowered from the most recent agricultural expansion, but the current profitability is at a higher level than the prior 25 years.
Western agriculture is currently producing significantly higher average profitability from both an average NOI per acre as well as a percentage of average land values. The disparity is likely because Western agricultural production is focused on farm products closer to the consumer (i.e., fruits, nuts, and vegetables), and those states tend to show higher profitability than those in grain-intensive states. However, higher risks tend to follow higher returns, and Western growers certainly have several unique risks to manage including water access, lack of generic commodity markets (i.e., you can’t buy apple futures on the CME), and a labor-intensive process that is highly reliant on the U.S. immigration system to manage workflow.
In general, average returns for cash rent at the state and regional level tend to normalize with the returns to operators as landlords increase rents to share in the increased profitability. Declines in state average NOI for operators also leads to declines in average cash rents, but rents tend to be sticky and take time to show up in the data. Average rental returns offer lower volatility compared to operating returns, but that also limits upside potential from year-to-year as increases in NOI are absorbed into rental rates over several future periods.
ABOUT THE AUTHOR

Jackson Takach, an economist and director of economic and business innovation with Farmer Mac, is a Kentucky native whose strong ties to agriculture began while growing up in the rural town of Scottsville. He joined the Farmer Mac team in 2005, and has worked in the research, credit, and underwriting departments. Takach is the lead author and creator of “The Feed”, Farmer Mac’s quarterly publication on the agricultural sector, and he regularly presents to lenders, producers, and industry experts throughout the year. He holds a bachelor’s degree in economics from Centre College, a master’s degree in agricultural economics from Purdue University, and an MBA and a Master’s degree in finance from Indiana University’s Kelley School of Business. He has also been a CFA charterholder since 2012.
To View Full Article: Click Here