Trending, Not Tumbling: Why Ag Loan Performance Signals Stability (For Now)

Reading the Tea Leaves of Farm Loan Portfolio Data
Deciphering the complex signals of the farm economy can be a tough job. The USDA releases myriad data throughout the year to aid in this interpretation, such as Commodity Cash Receipts, Farm Income and Wealth Statistics, and Commodity Cost of Production forecasts. Economists and pundits also routinely cite the U.S. Courts data for its quarterly release of Chapter 12 bankruptcy statistics (the chapter of the U.S. bankruptcy code designed specifically to address the needs of family farmers, ranchers, and fishers). This data is incredibly timely and relevant in interpreting the rich tapestry that is the U.S. agricultural economy. However, there is one set of data that can go overlooked by many: farm lender portfolio performance.
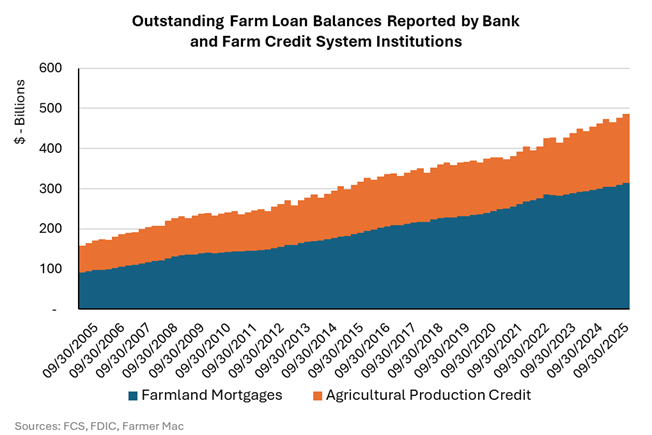
Farming is a capital-intensive business, and farmers and ranchers utilize debt capital for many reasons and from a variety of sources. Two of the primary uses of debt capital are for land investment (farmland mortgages) and for annual operating expenses (agricultural production credit). According to USDA data, farmland mortgages have grown at a compounded annual rate of 6.2% per year for the last 20 years, and agricultural production credit has grown at an annualized rate of 3.9% per year over the same period. That compares to a compounded annual growth rate of just 2.5% in residential mortgages. Two of the largest institutions that provide debt capital to U.S. farmers and ranchers are commercial and community banks (banks) and Farm Credit System (FCS) institutions. Combined, these two types of debt capital represent approximately 80% of all farm loans outstanding across more than 2,600 banks and 59 FCS institutions. The graph below highlights the consistent growth in debt capital deployed to support America’s farmers and ranchers across the country.
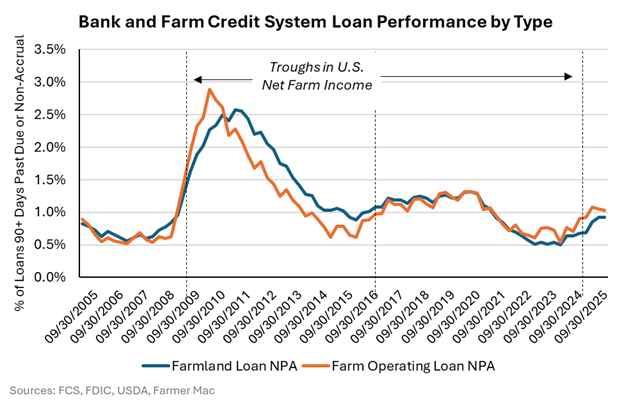
Because both lender groups have prudential regulators, their financial reports offer a unique window into the financial health of farmers and ranchers. Banks and FCS institutions file standardized call reports with their respective regulators, which are then published quarterly. The call report data is granular enough to break down loan balances and performance by categorized loan typology, including farmland mortgages and agricultural production credit. The graph below highlights the non-performing loan rates (the percentage of loans that are either past due for at least 90 days or are in non-accrual status) for the combined institution call report data broken out by type of loan. This graphical data demonstrates the cyclical trends in farm loan performance over the last 20 years and helps to establish a baseline against which to judge current conditions.
Despite some significant economic headwinds, agricultural loans are performing near historical norms through September 30, 2025. Farm Credit Administration and FDIC/FFIEC call report data show that the 20-year average non-performing loan rate for both series is approximately 1.0%, which mirrors the Q3 2025 values. Loan overdue payments tend to lag stress in the farm economy, making them a lagging indicator of financial strain for producers. For the last three agricultural economic down cycles, the non-performing loan rate increases to historical averages in the quarters leading up to the low point in farm incomes, and then proceeds above the historical average for the duration of the down cycle. If this pattern repeats, there could be additional delinquencies and defaults ahead for producers if commodity prices remain pressured and elevated input costs persist.
Regional Disparities Popping Out
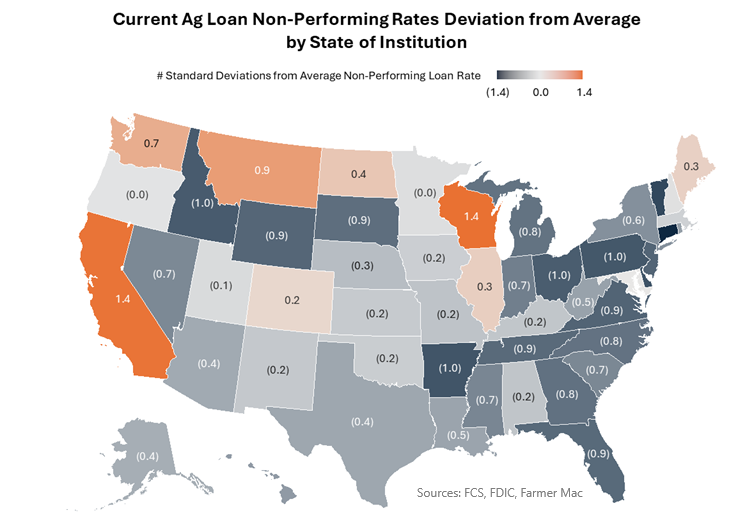
The individual call report data also allows for a geographic breakdown of loan performance. Each institution reports a headquarters location, and while institutions routinely operate across state borders, grouping the loan performance by institution headquarters helps illuminate some regional pockets of financial stress. For example, the total agricultural loan non-performing rate for lending institutions headquartered in California was 2.1%, more than two times higher than the national total and almost two times higher than the long-run California state average. Producers in California are fighting multiple headwinds (see Sour Grapes: Wine Consumption Decline Stresses Growers and Farmland Price Index), so it is not surprising to see delinquent payments rise faster for lenders centered in the state compared to those in other states. Some states are experiencing significantly lower non-performing ag loan rates compared to averages. For example, institutions headquartered in Arkansas have reported a non-performing ag loan rate of 0.7% as of September 30, 2025, well below the state historical average of 1.1%. Despite stresses in the soybean and cotton markets affecting producers in the state, most borrowers have continued to make loan payments throughout 2025.
The map below plots how many standard deviations away from average each state’s ag loan non-performing rate currently sits. A high positive number indicates loan delinquencies are extremely high relative to average, a high negative number indicates loan delinquencies are exceptionally low relative to average, and anything with one standard deviation is near average. California and Wisconsin lenders reported the highest levels of non-performing assets relative to state averages with current levels 1.4 standard deviations above normal. Most states are within one standard deviation of normal, indicating a return to average for most lending institutions. But some states remain below normal, including Idaho, Wyoming, South Dakota, Arkansas, and Ohio. Many of the states with near or below average non-performing ag loan rates have material livestock industries, helping to buffer delinquency rates with exceptional profitability levels in the last year.
Trending, Not Tumbling
While loan performance data is a lagging indicator of farm financial stress, current levels of ag loan non-performance represent a return to average levels. Recent improvements in grain crop commodity prices, thawing of global trade, persistently high livestock profit margins, and increased government support for many producers is helping to stymy financial stress across some regions and production typologies. These supports could help keep ag loan delinquencies, defaults, and bankruptcies from spiraling too far above average. However, if economic conditions remain stagnant or worsen, these levels could continue to rise as they did in prior economic contractions. Portfolio risk management will be increasingly important for financial institutions to mitigate increasing financial stress in their loan portfolios.