


%20Net%20Yields.svg)


Farmland markets sent mixed signals across the country this summer. The USDA released the annual Land Values report in August, which showed a continued march higher for farmland values in every U.S. state. In contrast, the Farmer Mac Farmland Price Index powered by AcreValue (FPI) indicated a decline in the average transaction price in Q2 2025 compared to the same period last year. Both indicators can coexist—the divergence likely stems from the data from which they are derived.
Transaction data for Q2 2025 showed a decline in the Farmland Price Index (FPI), which fell to $7,592 per acre—down 6% from $8,069 per acre in Q2 2024. At the same time, revisions were made to previous FPI values, including lowering the Q1 2025 average to $8,055 per acre, reflecting newly reported transactions. The drop was largely driven by lower average sales prices in several key agricultural states.
The modest decline in the FPI contrasts with the recently released USDA Land Values report. In August, the USDA released its annual report, which showed that U.S. farm real estate values, on average, rose to $4,350 per acre, up from $4,170 in 2024. Cropland values increased to $5,830 per acre in 2025, compared to $5,570 last year. Regionally, the Midsouth experienced the largest gains over the past year, according to the USDA report. Cropland values in Texas increased 5.4%, and Oklahoma saw a 6.9% increase. On the West Coast, growth was more tepid, but still positive—California cropland values increased 3.5%, on average, from June 2024 to June 2025.
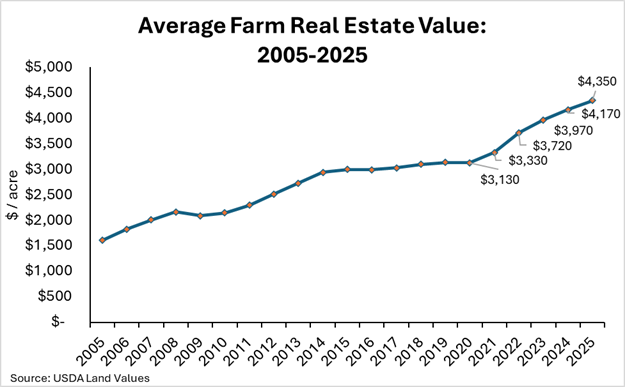
The notable differences in value and direction of the two farmland series are likely attributable to the method in which the data for each series is collected, and how the data is turned into a national average. The USDA Land Values report is based on an annual survey administered in June that asks respondents what they believe their owned or rented farm real estate is worth. The FPI, on the other hand, is based upon actual transaction data and weighted to account for regional variation in agricultural production. In general, survey-based data tends to be more stable than actual market transactions. For example, the USDA Land Values reports from 2020 through 2023 often showed weaker farmland value growth than many states were realizing during that period.
Today, the FPI shows land values have begun plateauing in many states while USDA survey responses continue to reflect optimism among farmland owners and renters. It’s possible USDA respondents have yet to pick up on land sale trends, indicating a lag may exist between perception and market activity. However, the USDA survey also underscores the resiliency of farm real estate values, as those who interact directly with the asset class continue to believe in its short-term and long-term value.
Footnote: The USDA national average farm real estate value is calculated from survey responses that are weighted based on the number of acres within each state. The FMAC FPI is derived from actual transaction data and weighted to account for regional variation in agricultural production. To further understand this difference, please reference the Farmer Mac Feed article “Understanding Farmland Value Trends: Introducing a New Farmland Price Index”
Related Insights
A Big Step Higher, a Small Step Down for Farm Incomes Insight
Grains and Oilseeds Supplies Challenged by Big Brazilian Crop Insight